


Get Shipment Clarity at a Glance with the UBQ Network Platform
Picture this: A shipment of fresh avocados leaves the packing shed in Chile, headed first for London and then on to Port Verde in Mallorca. By the time the receiver opens the container in Mallorca, the fruit has spoiled.
Months of effort in the orchard, careful trucking to the port, and a long ocean voyage—all wasted. But the real question is: where did things go wrong? Was it on the truck? During the ocean leg? Or while being handled at a dock?
If you only discover the problem at arrival, it’s already too late.
Why Real-Time Matters
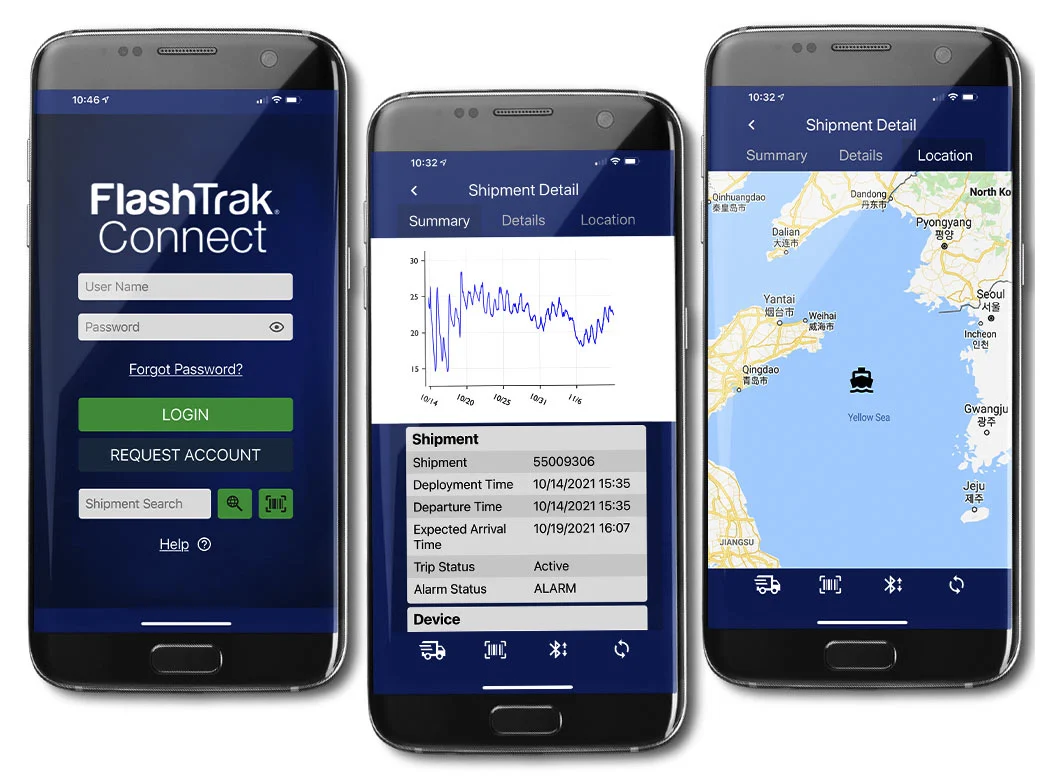
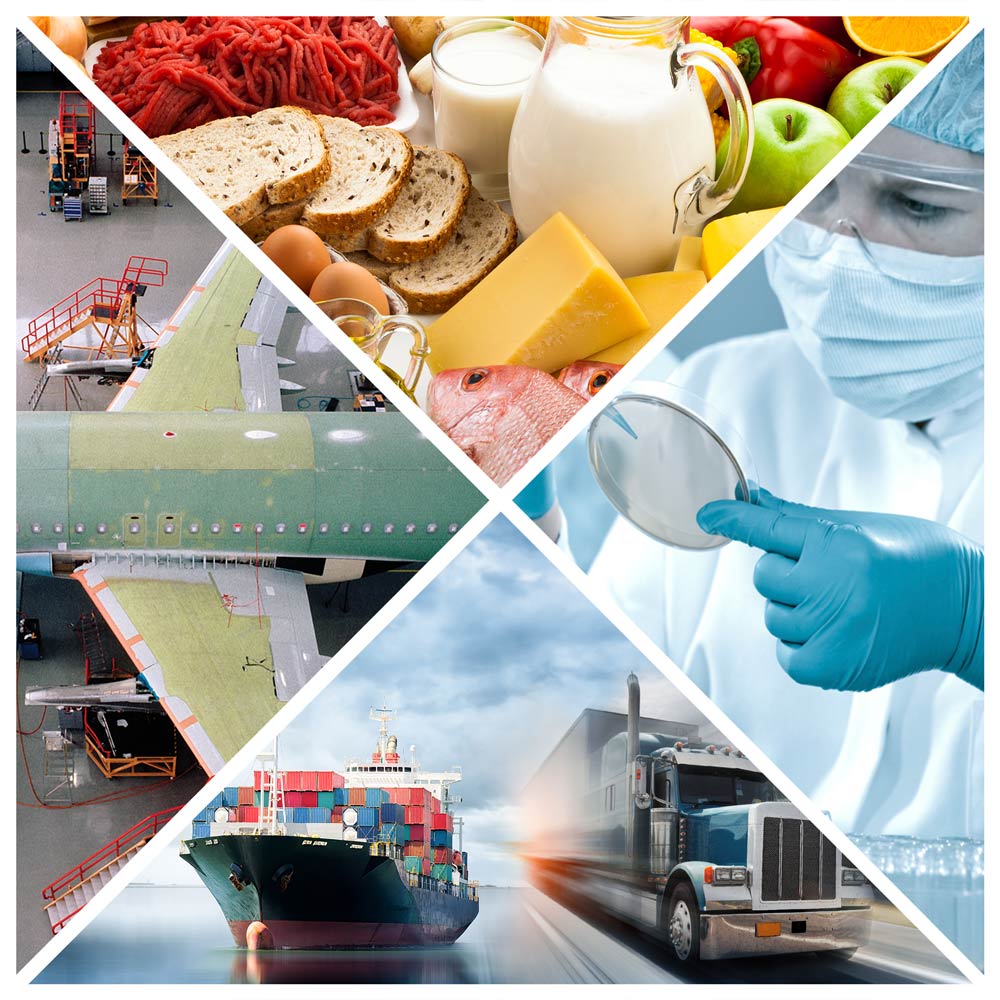
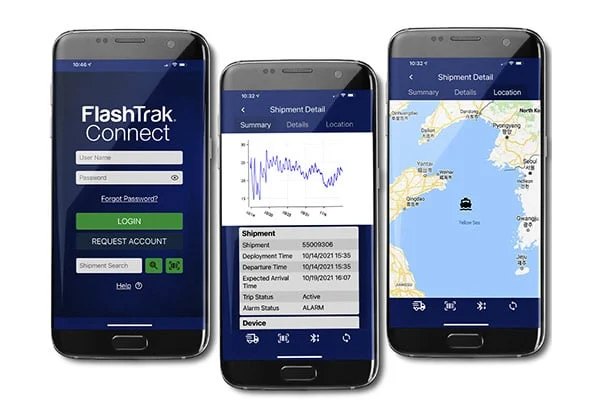
When you’re shipping high-value perishables—whether avocados, sea bass, or beef—you can’t afford to be in the dark. You need to know where your shipment is, what condition it’s in, and when something goes wrong. That visibility allows you to:
- Act before damage becomes irreversible
- Pinpoint where an excursion occurred for insurance claims
- Identify weak points in complex, multi-stop journeys
The Avocado Shipment Problem: Solved at a Glance
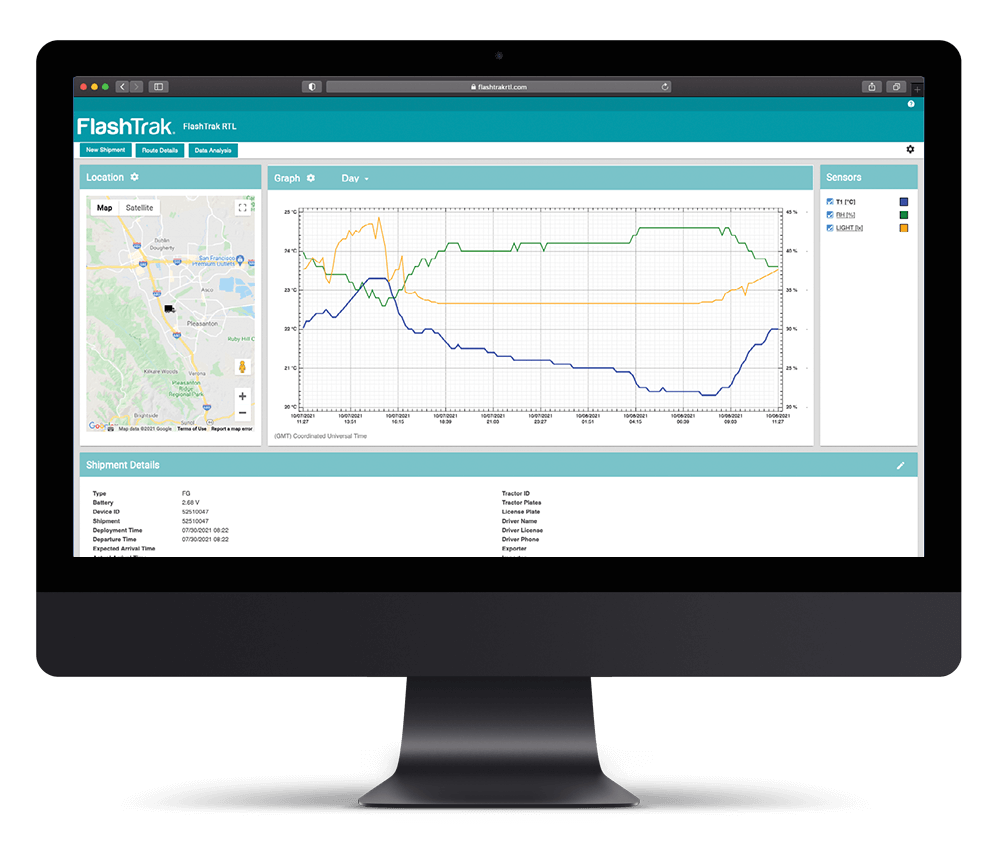
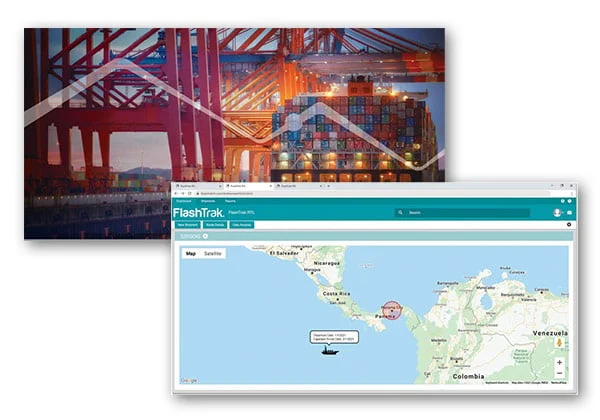
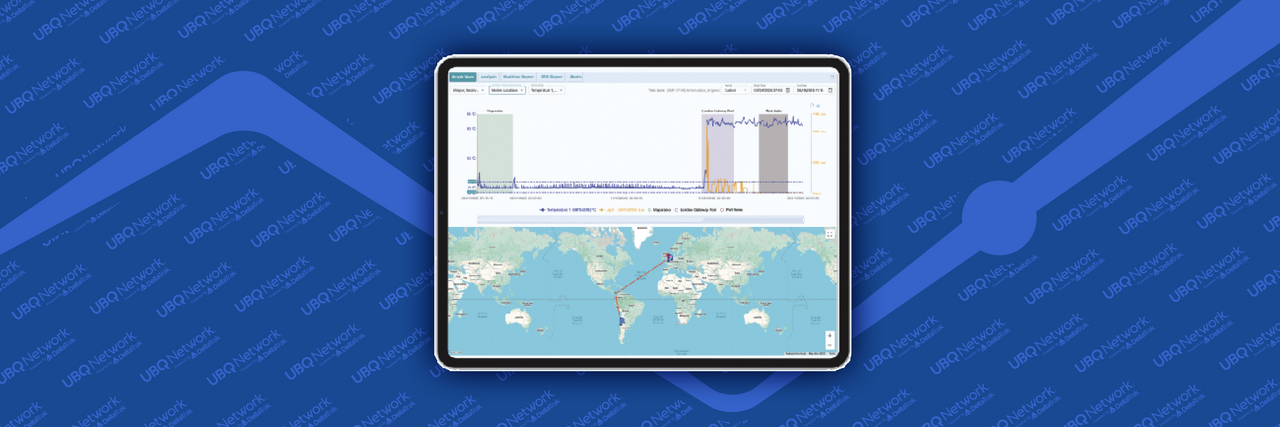
This is where the UBQ Network cloud platform powered by DeltaTrak makes a difference. Instead of flipping between multiple graphs or digging through reports, you get shipment clarity at a glance.
On the UBQ Network software platform, you can now access a segmented trip report
On the software’s Graph View, each transport segment in the segmented trip report is color-coded:
- The initial trucking leg from the Chilean packing shed to Valparaíso port is shaded in one color, displaying temperature and other environmental factors like humidity, light, and shock.
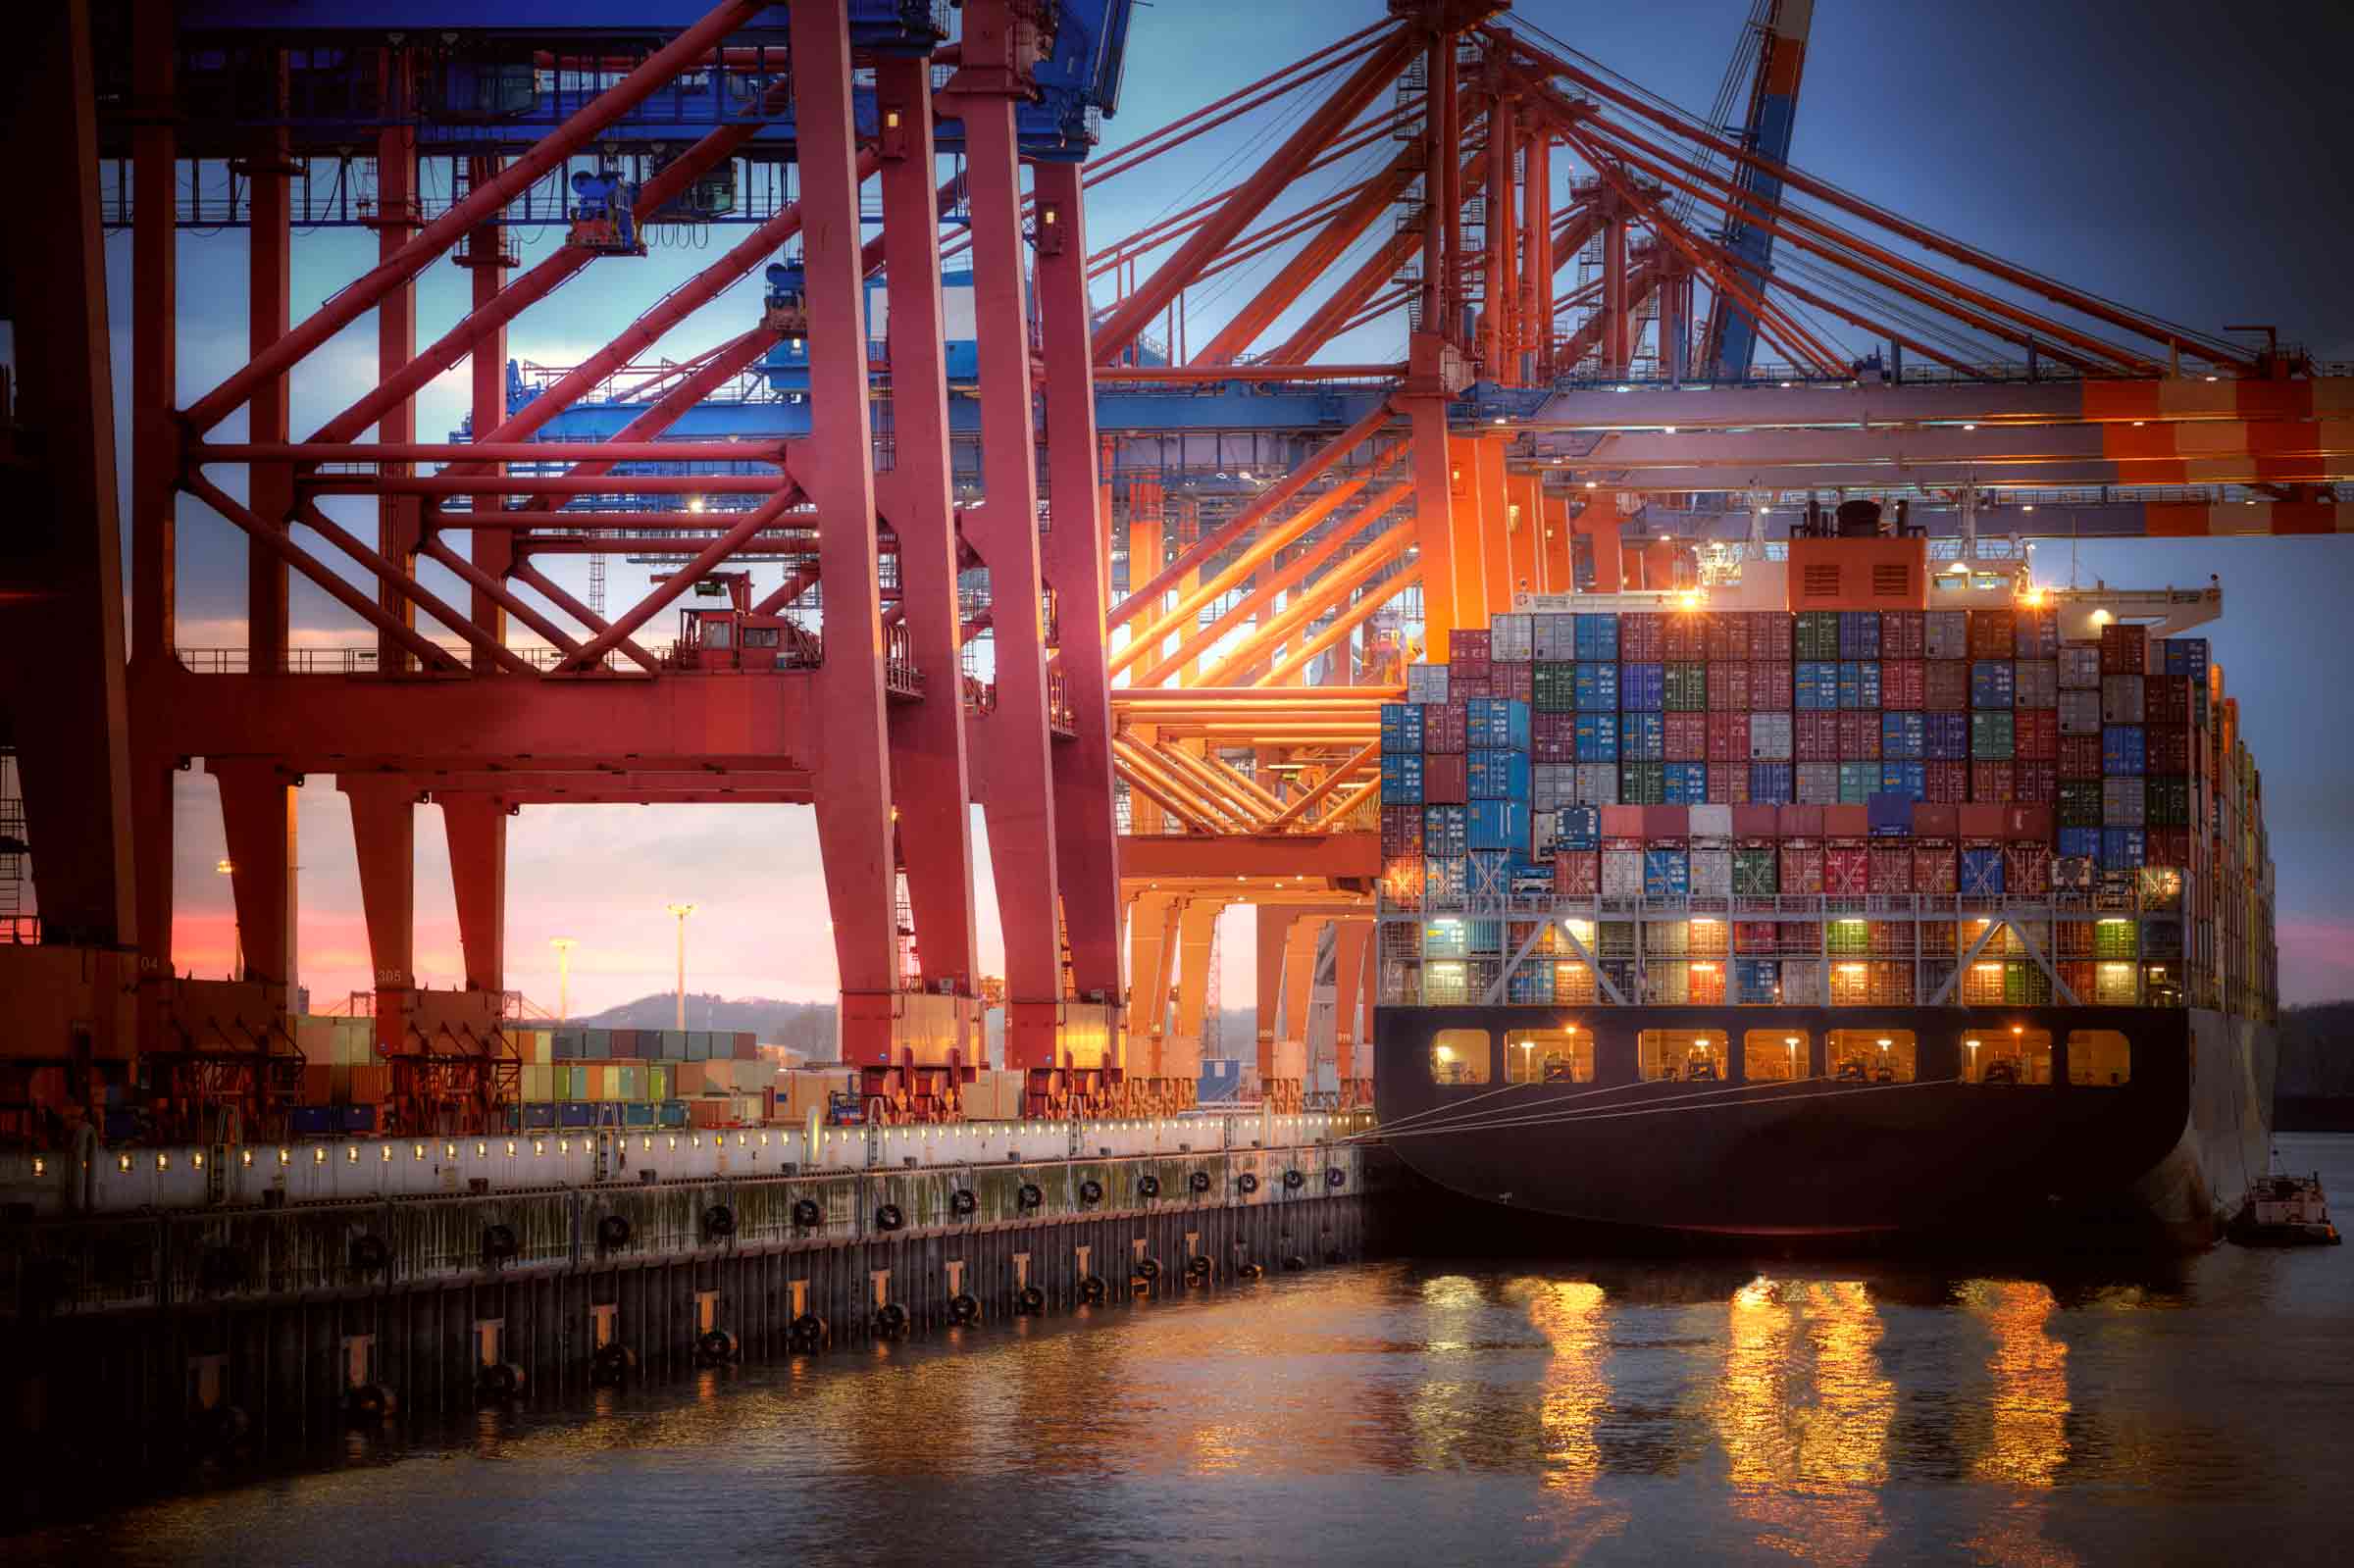
- The long ocean segment is shown with a white background.
- The trucking segment from London Gateway Port to the next port is shaded in another color.
- The subsequent ocean voyage from England to Port Verde appears again with a white background.
- Finally, the short trucking leg to the end destination is shaded in a different color.
The initial trucking leg from the Chilean packing shed to Valparaíso port is shaded in one color, displaying temperature and other environmental factors like humidity, light, and shock. The long ocean segment is shown with a white background. The trucking segment from London Gateway Port to the next port is shaded in another color. The subsequent ocean voyage from England to Port Verde appears again with a white background.
Finally, the short trucking leg to the end destination is shaded in a different color.
All these segments combine into a single, easy-to-read graph that captures environmental conditions across the entire trip—from orchard to final delivery.
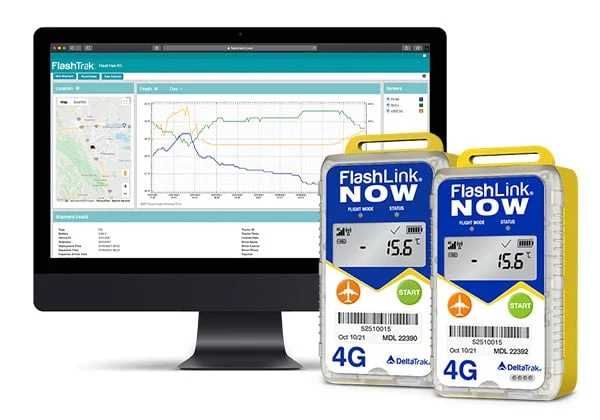
DeltaTrak Real-Time Loggers feed data directly into the UBQ Network cloud platform, providing visibility and alerts whenever conditions fall outside acceptable ranges.
The Result
With clear insight at every stage, you can act quickly, prevent losses, and build customer confidence. That means fewer claims, faster receiving, and more repeat orders from satisfied buyers.
With DeltaTrak and the UBQ Network, your avocados—and every premium product you ship—arrive fresh, not frustrated.

Jim Krachenfels
As a member of DeltaTrak's marketing team, Jim has been a prominent blogger on DeltaTrak's product line and cold chain. He has extensive experience in technology marketing and an MBA in marketing.