


Turning Visibility into Fresher Products and Less Waste: Meet the UBQ Network Dashboard

Every extra hour your lettuce sits on a warm dock or your berries ride in a truck that’s creeping above 2°C is shelf life you’ll never get back. And shelf life lost = shrink, claims, unhappy retail partners, and perfectly good food headed to landfill.
If your goal is to get produce to store shelves as fresh as the day it left the field—while hitting In Temp and On-Time In-Full targets and cutting waste—you need eyes on every load, every minute. That’s exactly what the UBQ Network dashboard delivers.
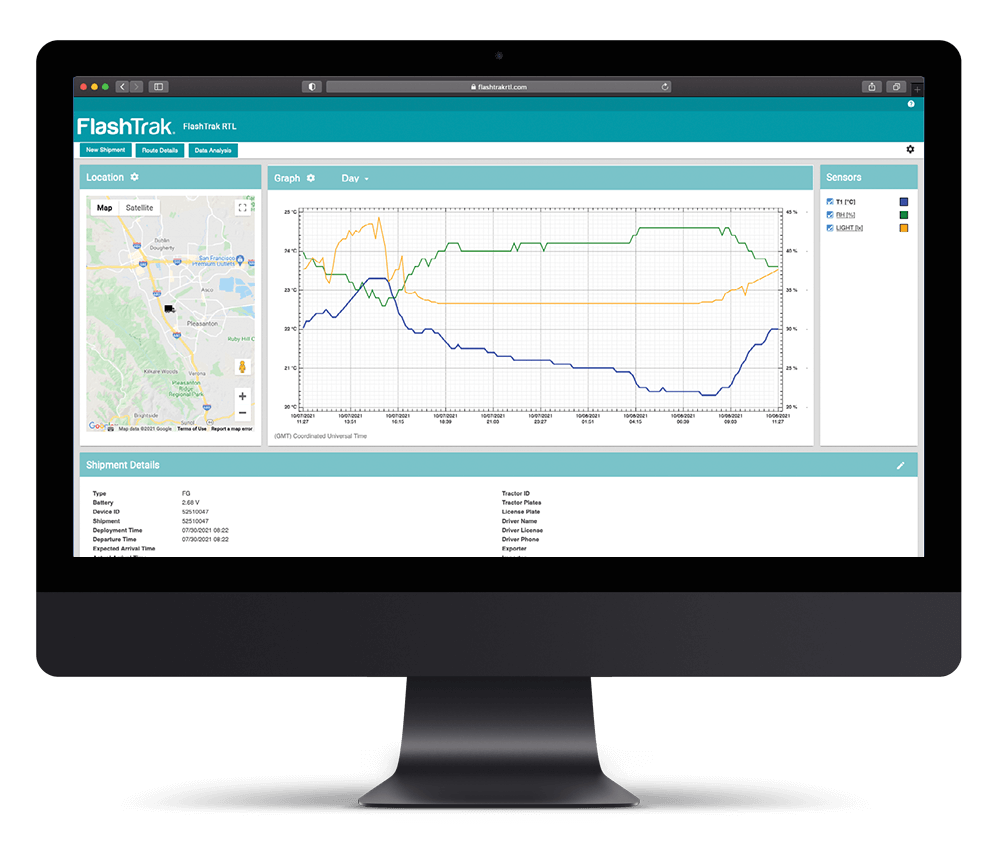
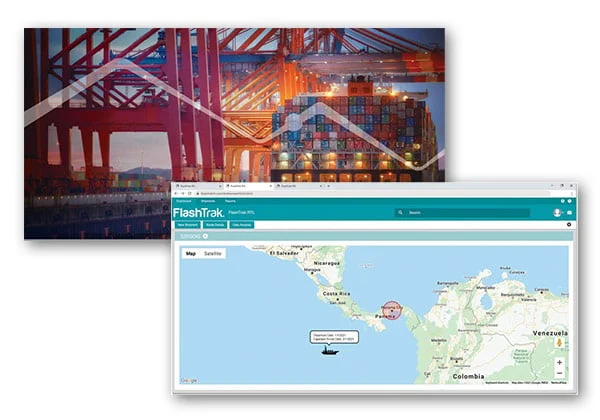
One login. Total cold-chain logistics visibility
Open the dashboard and you’re looking at your entire operation in real time—from the packing shed in California or Mexico straight through to the supermarket DC in Chicago or Miami.
With a single click you see:
- Total active shipments across every distribution center
- How many shipments are in an alarm state
- Shipment health trending up or down
- Clean, color-coded views broken out by commodity: produce, protein, dairy, dry goods—whatever you move
See a spike in alarms on romaine? Click on the alarms section and every affected shipment pops up, ready to drill into.
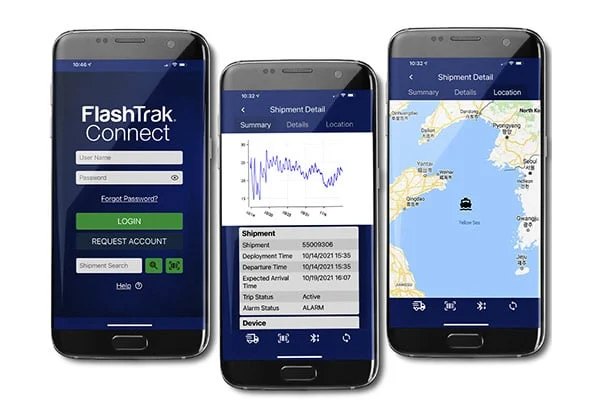
What this means for your bottom line
When issues surface the moment they start—not two weeks later on a claims report—you can act:
- Expedite or reroute a load that’s drifting warm and still land it fresh
- Back up delivery window and on-time in-fill (OTIF) claims with undeniable data
- Proactively reduce delays and dwell time at critical nodes and events
- Prove to retail buyers you’re the grower/shipper who consistently delivers the longest possible shelf life
- Rescue product that would have been rejected or dumped
The impact
Less shrink. Fewer penalties. Stronger retailer relationships. More fresh food actually eaten by consumers instead of wasted.
Curious how it would look with your lanes and your commodities loaded? Contact the UBQ Network powered by DeltaTrak and see if we can help.

Jim Krachenfels
As a member of DeltaTrak's marketing team, Jim has been a prominent blogger on DeltaTrak's product line and cold chain. He has extensive experience in technology marketing and an MBA in marketing.